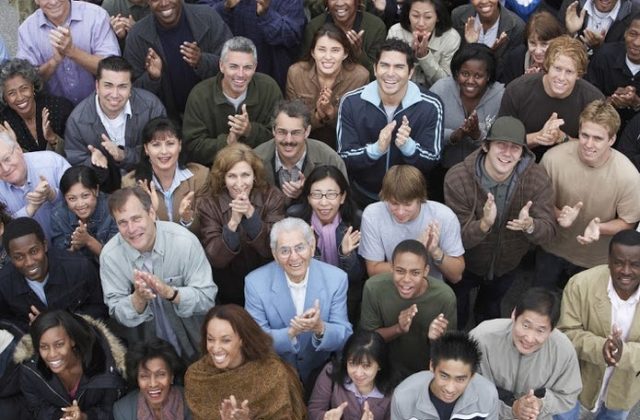
Ethnicity Make Up in Newton MA 2010
From Newton Patch:
Many cities and towns are a mix of culture and ethnic background among its residents, but some more diverse than others.
According to the latest Census statistics available (which is 2010), Newton’s population made up of:
- 82.3% white
- 2.5% African American
- 0.1% American Indian and Alaska native
- 11.5% Asian
- 0% Hawaiian
- 2.4% two or more races
- 4.1% Hispanic
How does that compare to the rest of the state?
Massachusetts statistics:
- 82.6% white
- 8.3% African American
- 0.5% American Indian and Alaska native
- 6.3% Asian
- 0.1% Hawaiian
- 10.8% Hispanic
According to a 2014 estimate, there are 88,287 living in Newton.
From Newton Gov:
| Newton | Massachusetts | United States |
|---|
| Hispanic or Latino (of any race) | 4.90% | 10.20% | 16.9% |
| One race | |||
| White | 80.30% | 80.00% | 73.90% |
| Black or African American | 3.50% | 7.00% | 12.60% |
| American Indian and Alaska Native | 0.10% | 0.20% | 0.80% |
| Asian | 13.00% | 5.70% | 5.00% |
| Native Hawaiian and Other Pacific Islander | 0.00% | 0.00% | 0.20% |
| Some other race | 0.60% | 4.20% | 4.70% |
| Two or more races | 2.50% | 2.80% | 2.90% |
| *The Census Bureau classifies all people not living in households as living in group quarters. There are two types of group quarters: institutional (for example, correctional facilities, nursing homes, and mental hospitals) and non-institutional (for example, college dormitories, military barracks, group homes, missions, and shelters).
Source: American Community Survey, 3-Year Estimates (2011-2013) |
|||
Newton North High School Enrollment from Mass Department of Education:
| Enrollment by Race/Ethnicity (2019-20) | |||
|---|---|---|---|
| Race | % of School | % of District | % of State |
| African American | 6.4 | 4.6 | 9.2 |
| Asian | 14.7 | 19.4 | 7.1 |
| Hispanic | 9.6 | 7.6 | 21.6 |
| Native American | 0.1 | 0.1 | 0.2 |
| White | 62.2 | 61.2 | 57.9 |
| Native Hawaiian, Pacific Islander | 0.0 | 0.1 | 0.1 |
| Multi-Race, Non-Hispanic | 7.0 | 7.0 | 3.9 |
Newton South High School Enrollment from Mass Department of Education:
| Enrollment by Race/Ethnicity (2019-20) | |||
|---|---|---|---|
| Race | % of School | % of District | % of State |
| African American | 4.9 | 4.6 | 9.2 |
| Asian | 21.7 | 19.4 | 7.1 |
| Hispanic | 6.3 | 7.6 | 21.6 |
| Native American | 0.0 | 0.1 | 0.2 |
| White | 61.3 | 61.2 | 57.9 |
| Native Hawaiian, Pacific Islander | 0.0 | 0.1 | 0.1 |
| Multi-Race, Non-Hispanic | 5.8 | 7.0 | 3.9 |
This is part of my series on Where Are the POC in the Newton Police Force?


